On any given day, Dub Analytics tracks upwards of 10 million clicks and conversion events.
With the sheer volume of data that’s tracked, it is important to be able to easily filter and create reports to help marketing teams make informed decisions.
In this guide, we’ll walk you through how to use Dub Analytics to get the most out of your click events and engagement data.
Live Demo
To give you some context before we dive in, here’s a live demo of Dub’s Analytics dashboard:
This public page was created using Dub’s shareable link feature. You can
create your own shareable link by following the steps in the Share your
analytics guide. Analytics Views
Dub’s Analytics dashboard consists of several views:
- Time-series analytics chart
- Aggregated data for different facets (top views)
- Real-time events stream
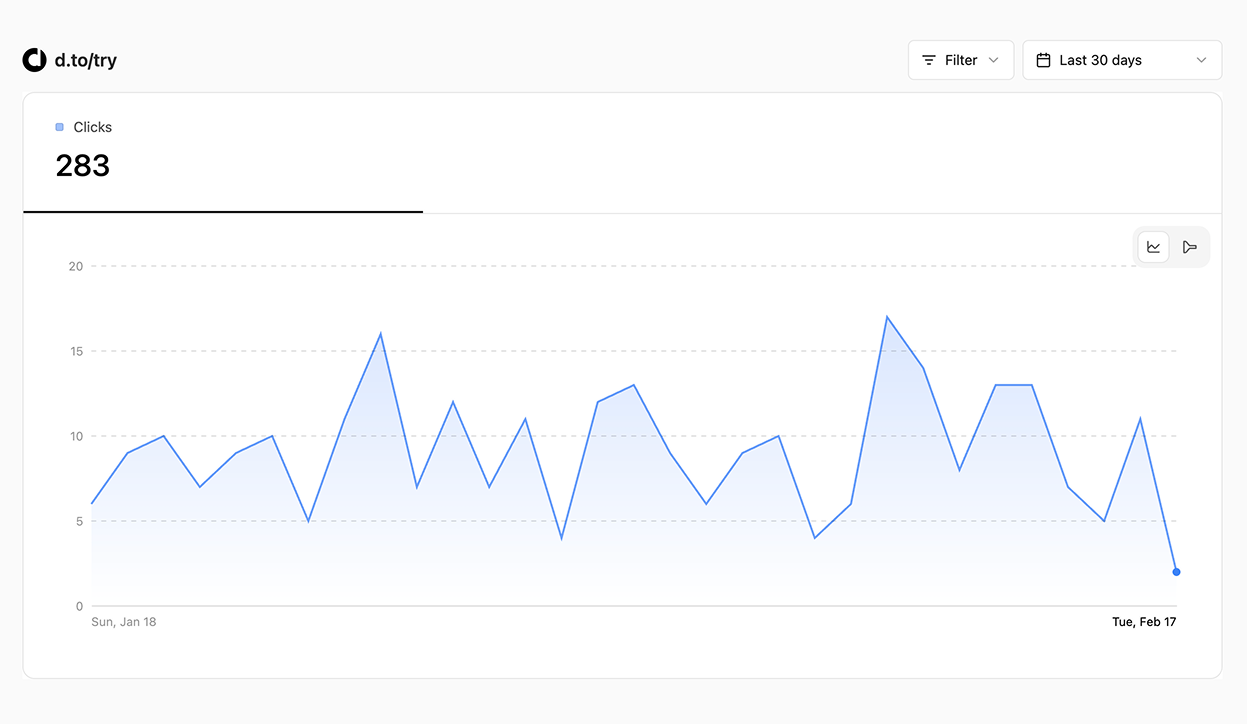
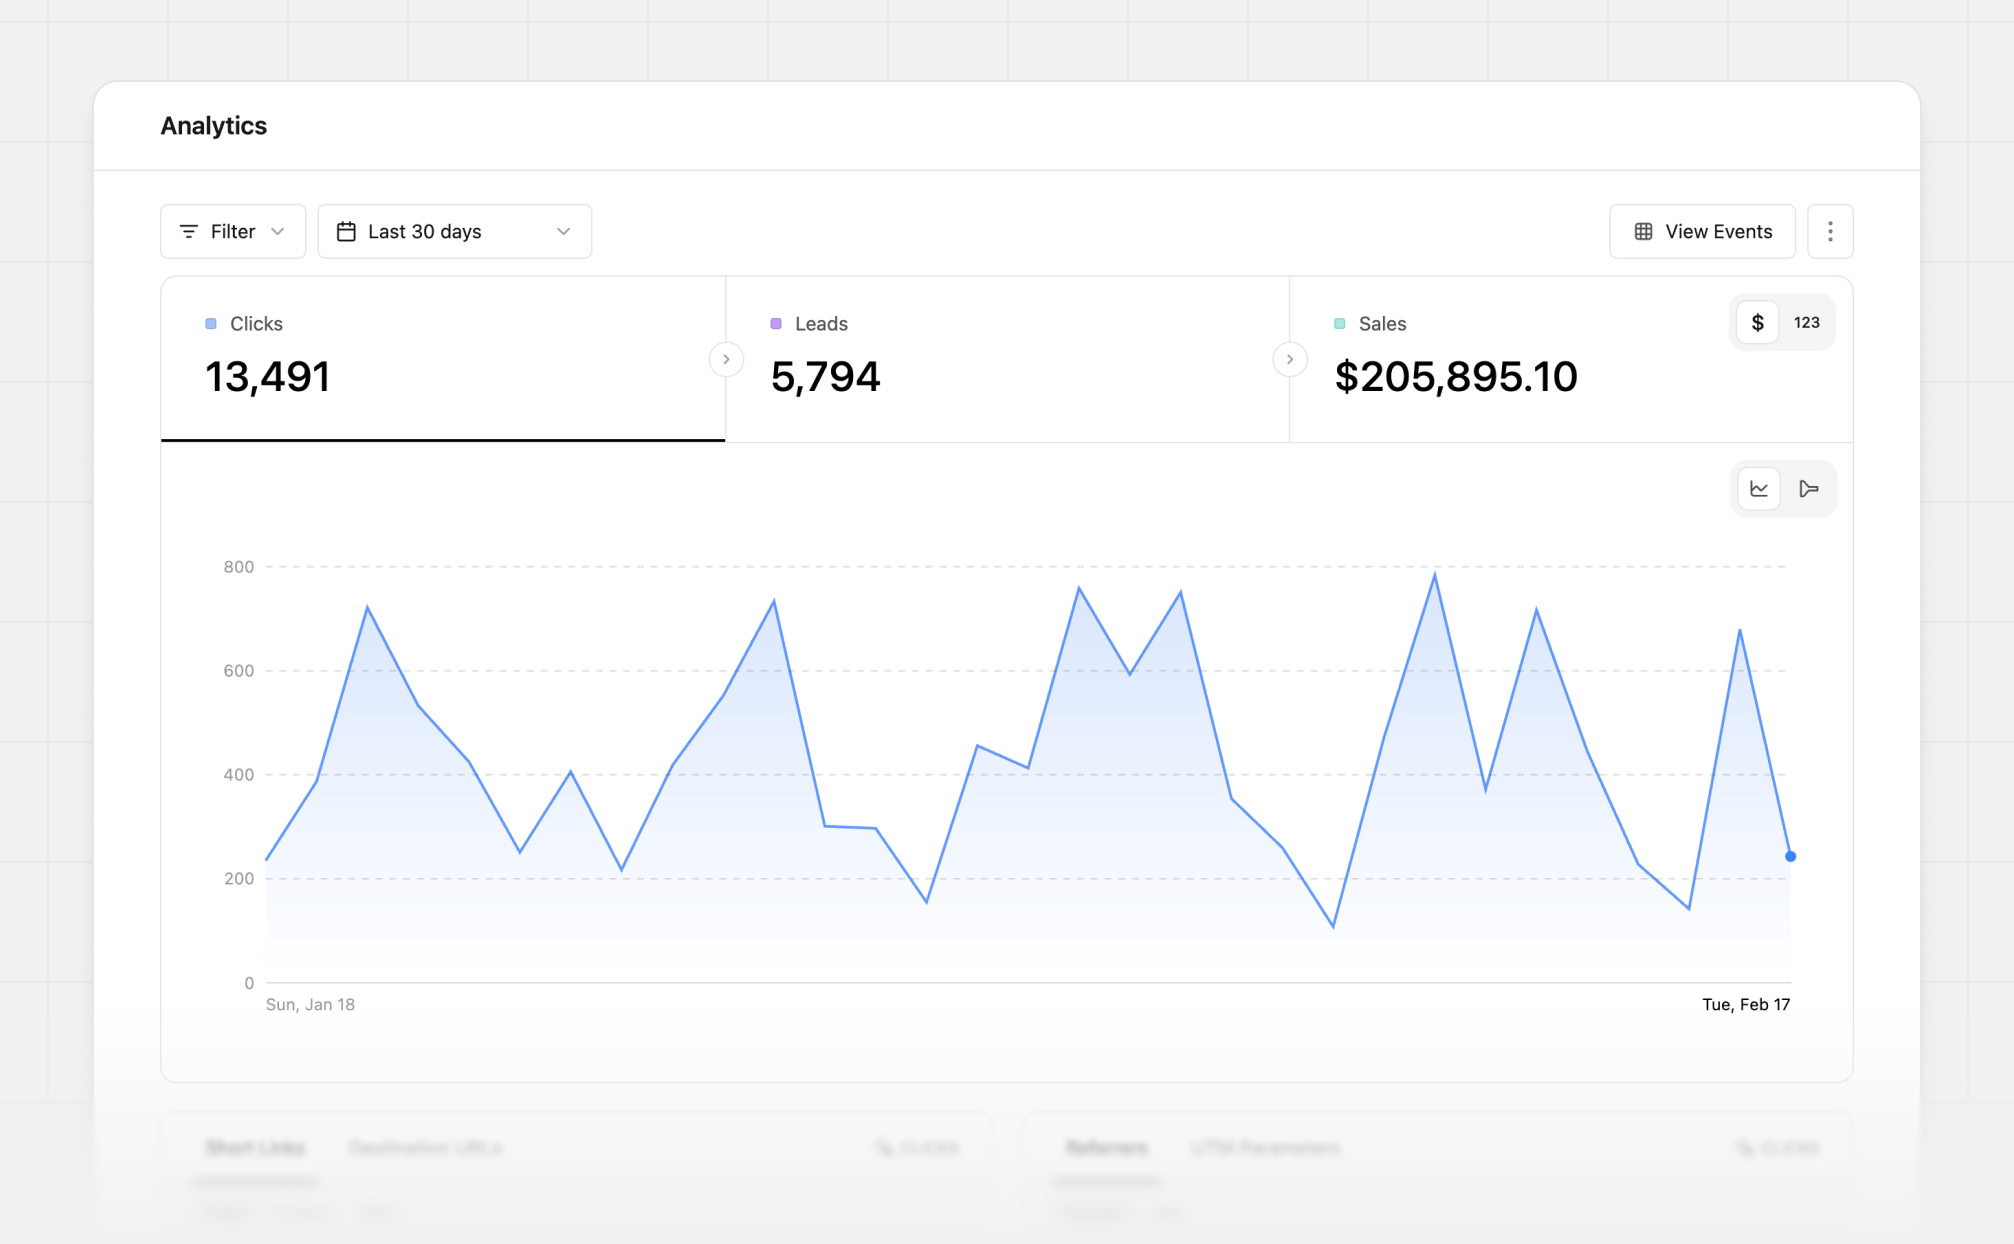
1. Time-series analytics chart
This is the default view and shows you the number of click events over time.
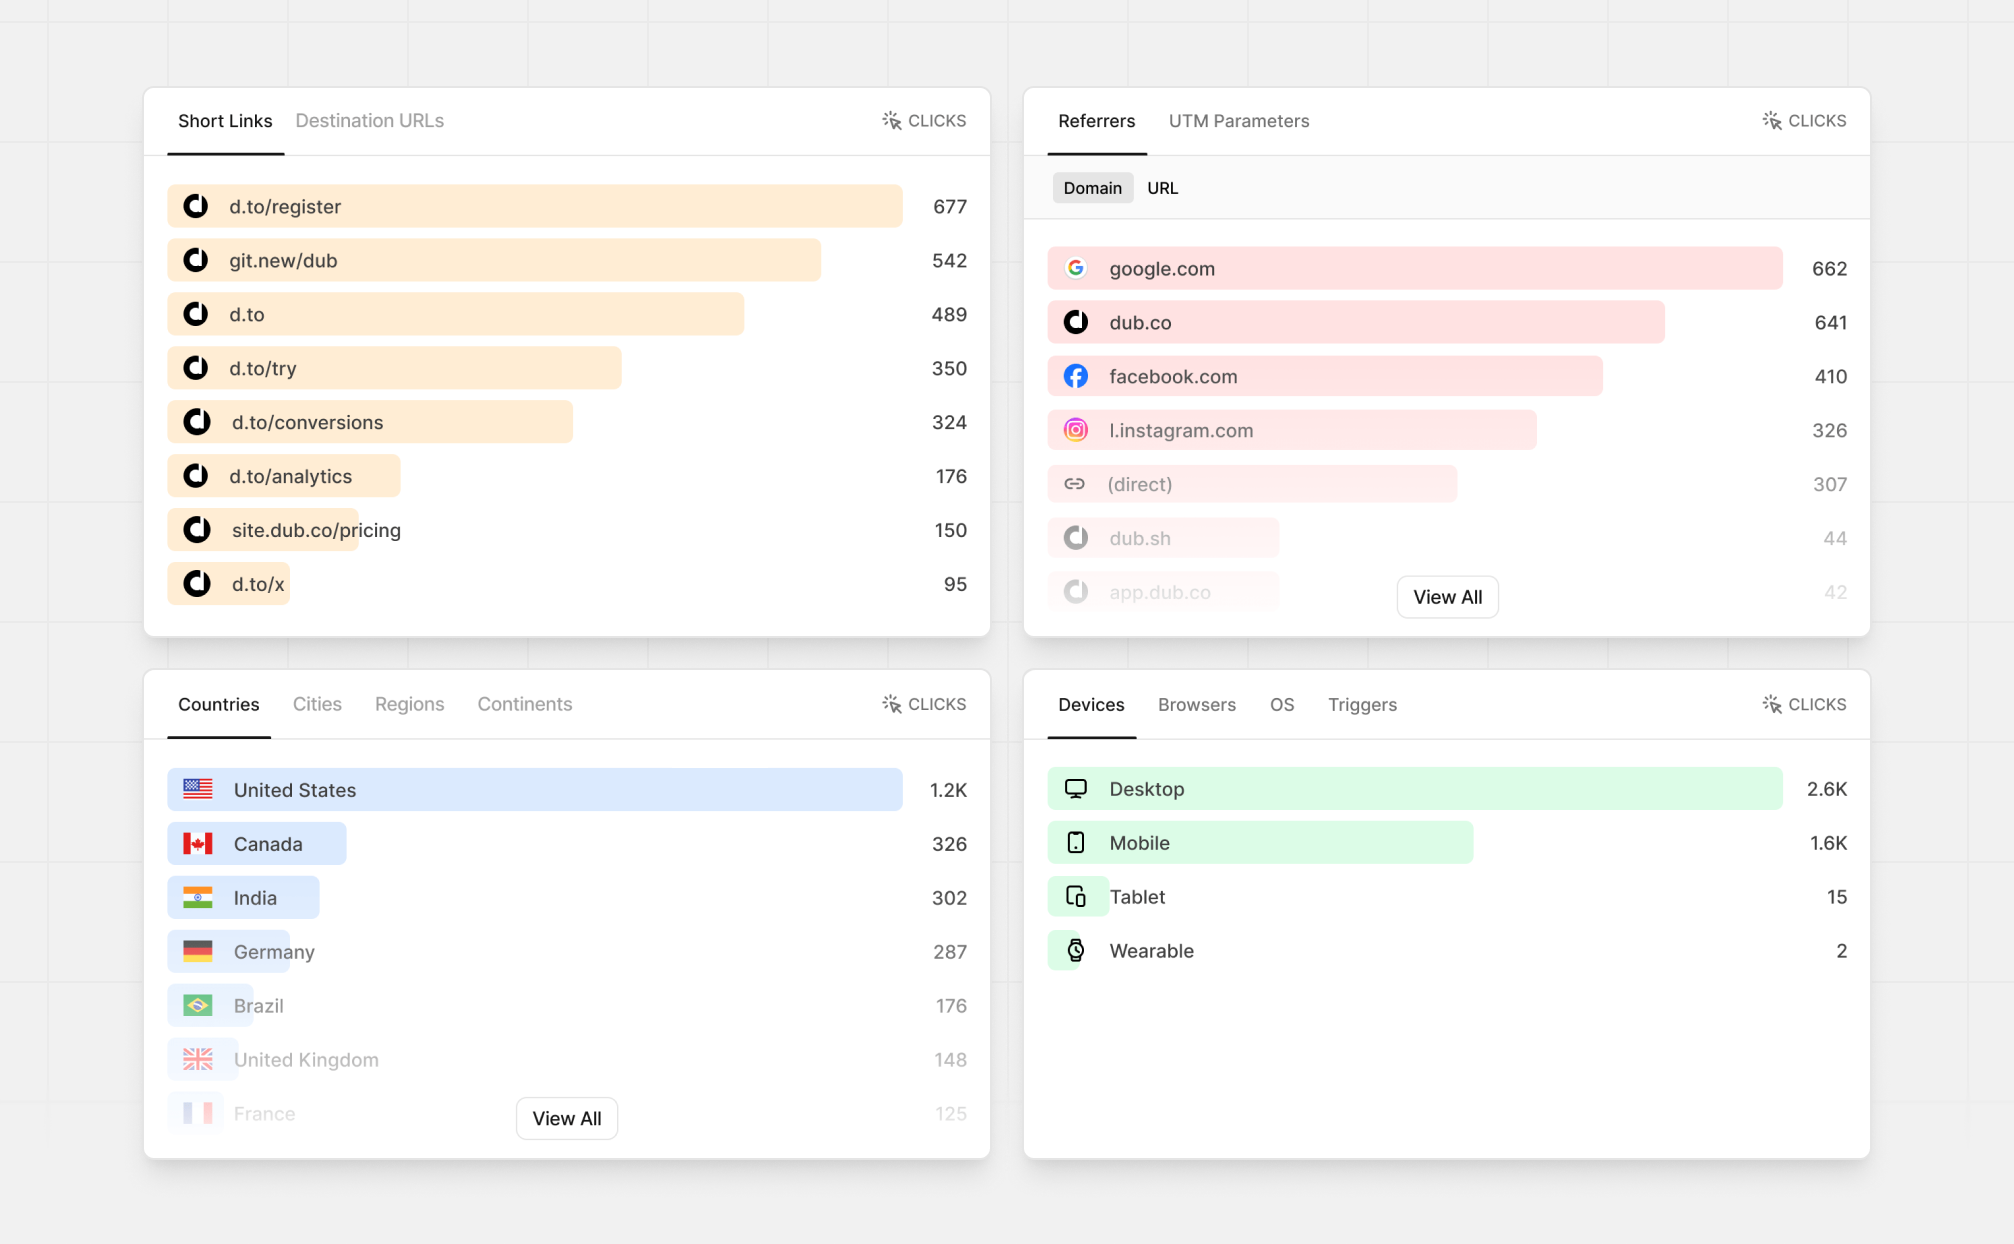
2. Aggregated data for different facets (top views)
These are more commonly known as the “Top Views” in Dub Analytics. These views show you the top links, countries, cities, devices, and more.
3. Real-time events stream
Dub also offers a Real-time Events Stream view that shows you the events that are happening in real-time. These events are sorted by the time they occurred, so you can see the most recent events first.
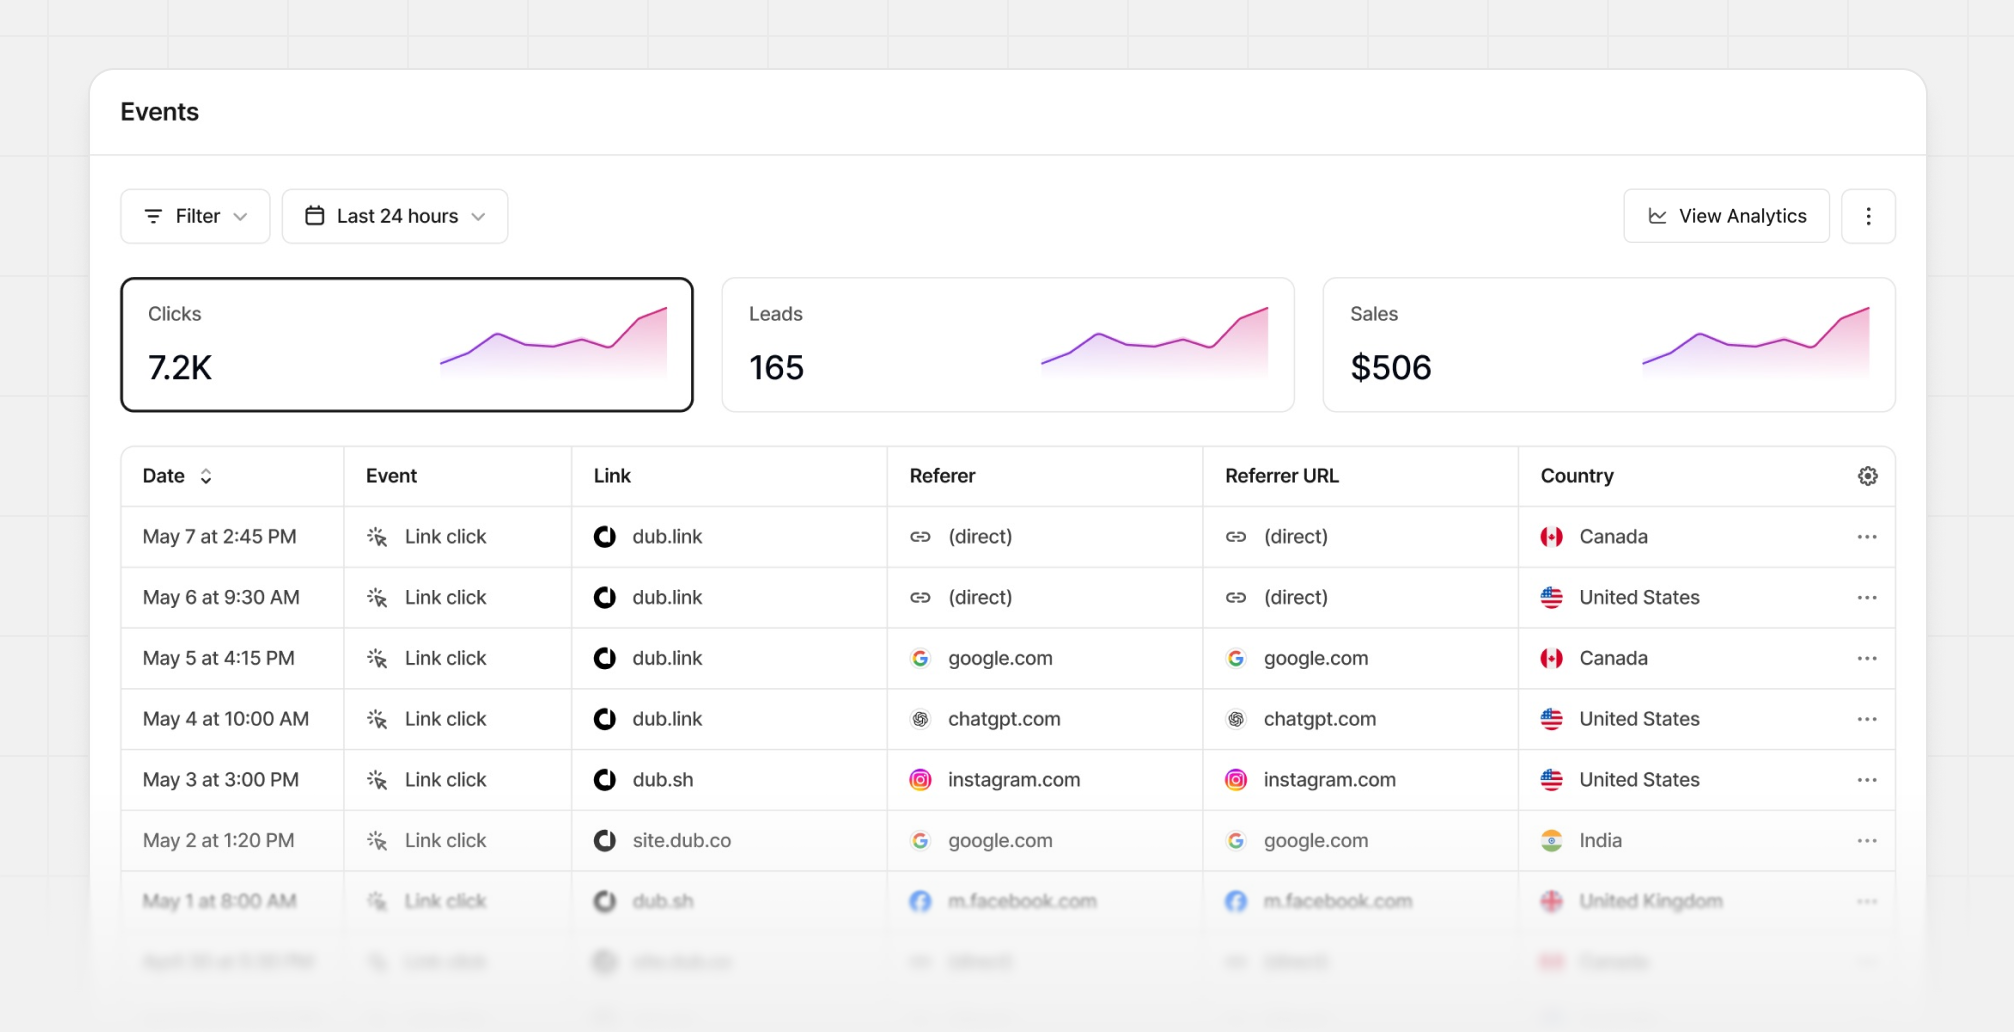 The real-time events stream lives in your workspace’s Events tab, but you can also access it via the View Events button in the Analytics tab:
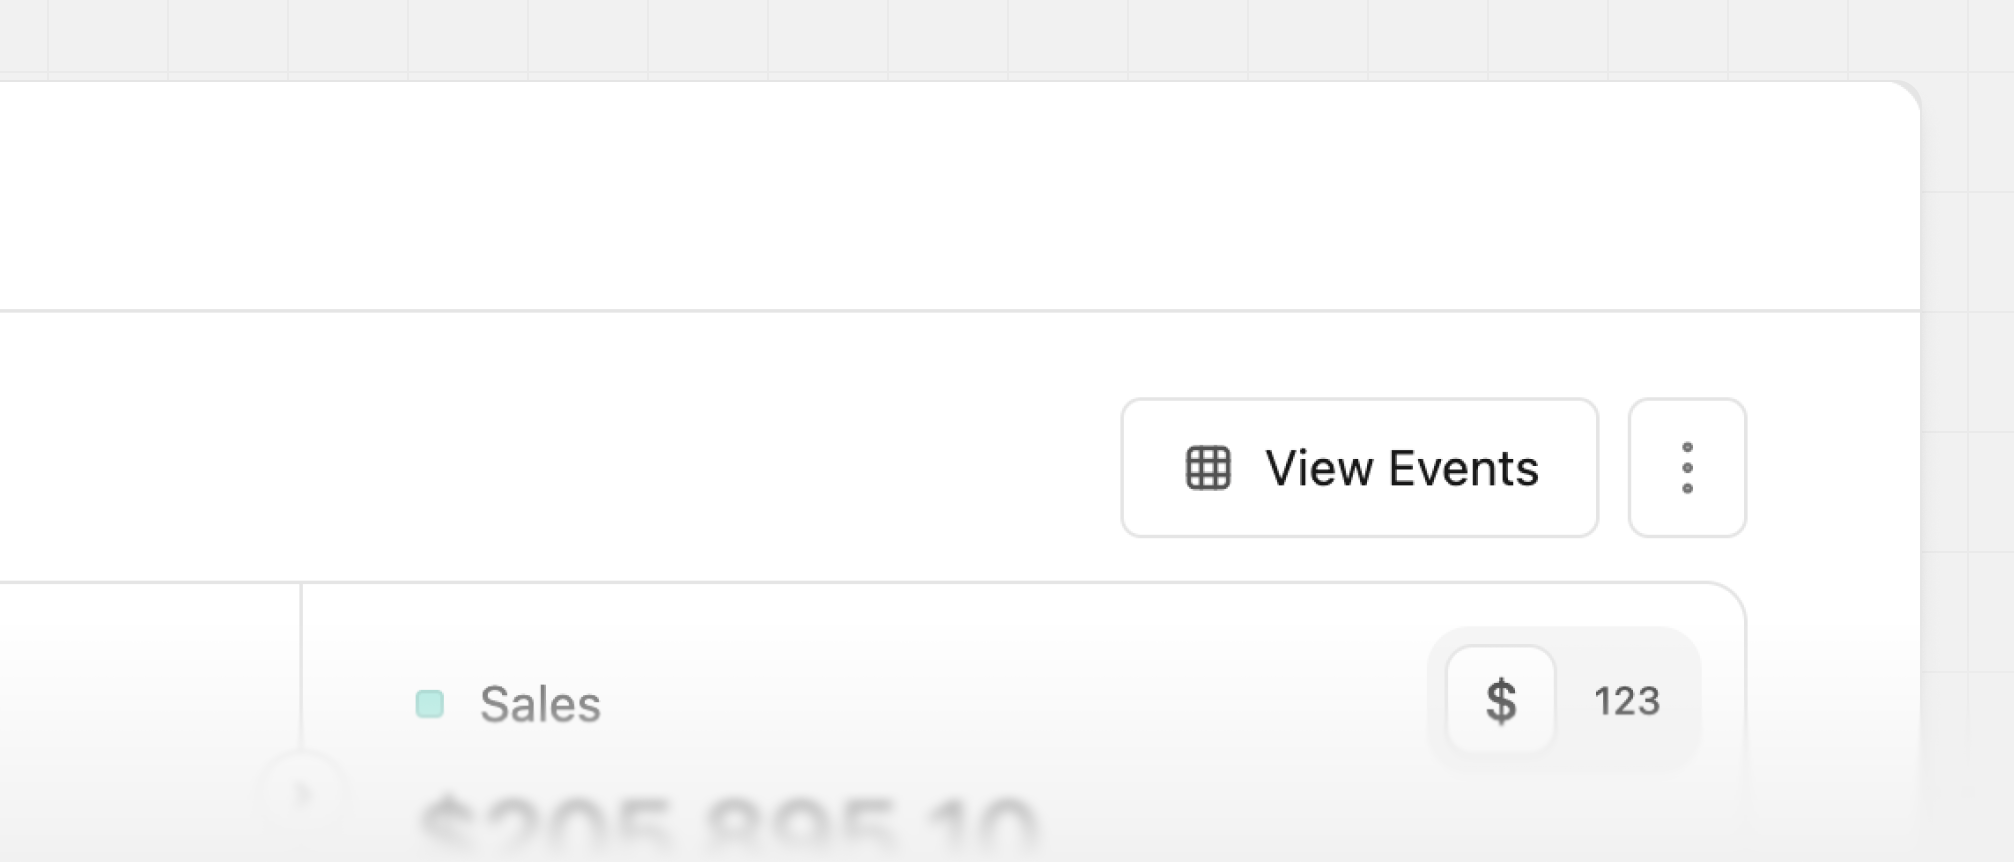
When you click on the View Events button, the same filters you have
applied in the Analytics tab are applied to the Events tab as well.
Date Range Picker
Dub Analytics comes with a powerful date range picker that allows you to select custom date ranges for your reports.
This is especially useful when you want to compare data over different time periods, or when you want to focus on a specific time frame that is not covered by the preset date ranges.
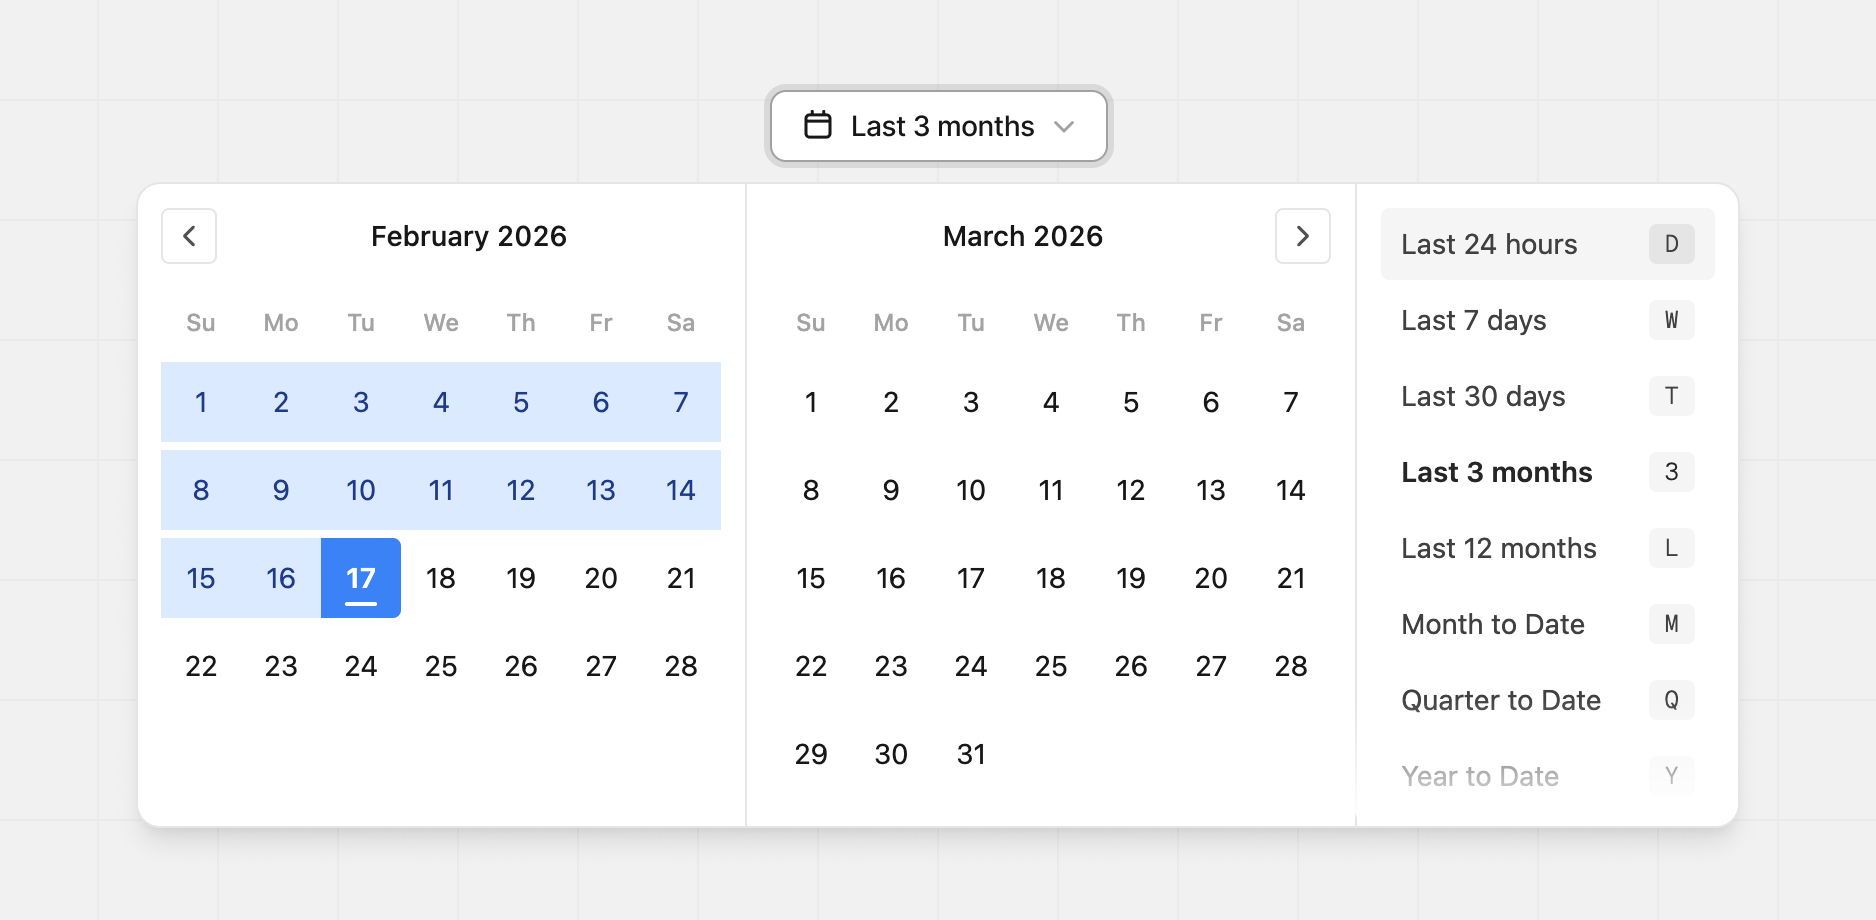
Pro-tip: You can use keyboard shortcuts to toggle between different preset date ranges:
D – Last 24 hoursW – Last 7 daysT – Last 30 days3 – Last 3 monthsL – Last 12 monthsM – Month to DateQ – Quarter to DateY – Year to dateA – All time
Filtering data
Dub’s analytics dashboard comes with a sleek and keyboard-friendly filter bar at the top of the dashboard that you can use to filter your data.
Here are some of the filter facets you can use:
- Domain – Filter by domain (e.g.
dub.sh, git.new, spti.fi)
- Tags – Filter by tags (e.g. Social Media, Email Campaign, Blog Post)
- Folders – Filter by folders (e.g. Partner links, Marketing links)
- Trigger – Filter by event trigger (e.g. link click, QR code scan)
- Device – Filter by device type (e.g. Mobile, Desktop, Tablet)
- Country – Filter by country (e.g. United States, India, Germany)
- City – Filter by city (e.g. San Francisco, New York, London)
- Region – Filter by region (e.g. California, New York, London)
- Continent – Filter by continent (e.g. North America, Europe, Asia)
- Browser – Filter by browser (e.g. Chrome, Safari, Firefox)
- OS – Filter by operating system (e.g. iOS, Android, Windows)
- Referrer – Filter by referrer (e.g. Direct, Google, Facebook)
- UTM Parameters – Filter by UTM parameters (e.g.
utm_source, utm_content)
Additionally, with Dub Partners, you can also filter by the following:
- Partner – Filter by individual partners to measure partner activity and ROI across different time ranges
- Partner Group – Filter by partner group (e.g. “Influencers” vs “User Referrals” vs “Affiliates” vs “Publishers”) to understand the ROI on each of your partnership channels
Pro-tip: You can use the F keyboard shortcut to open up the filter bar.
Advanced analytics filters
You can also use our built-in advanced filtering capabilities to create powerful, customized reports for your marketing campaigns:
Multi-filtering (“IS ONE OF”)
If you need to pull stats for multiple entities at once, you can now do so with our multi-filtering feature:
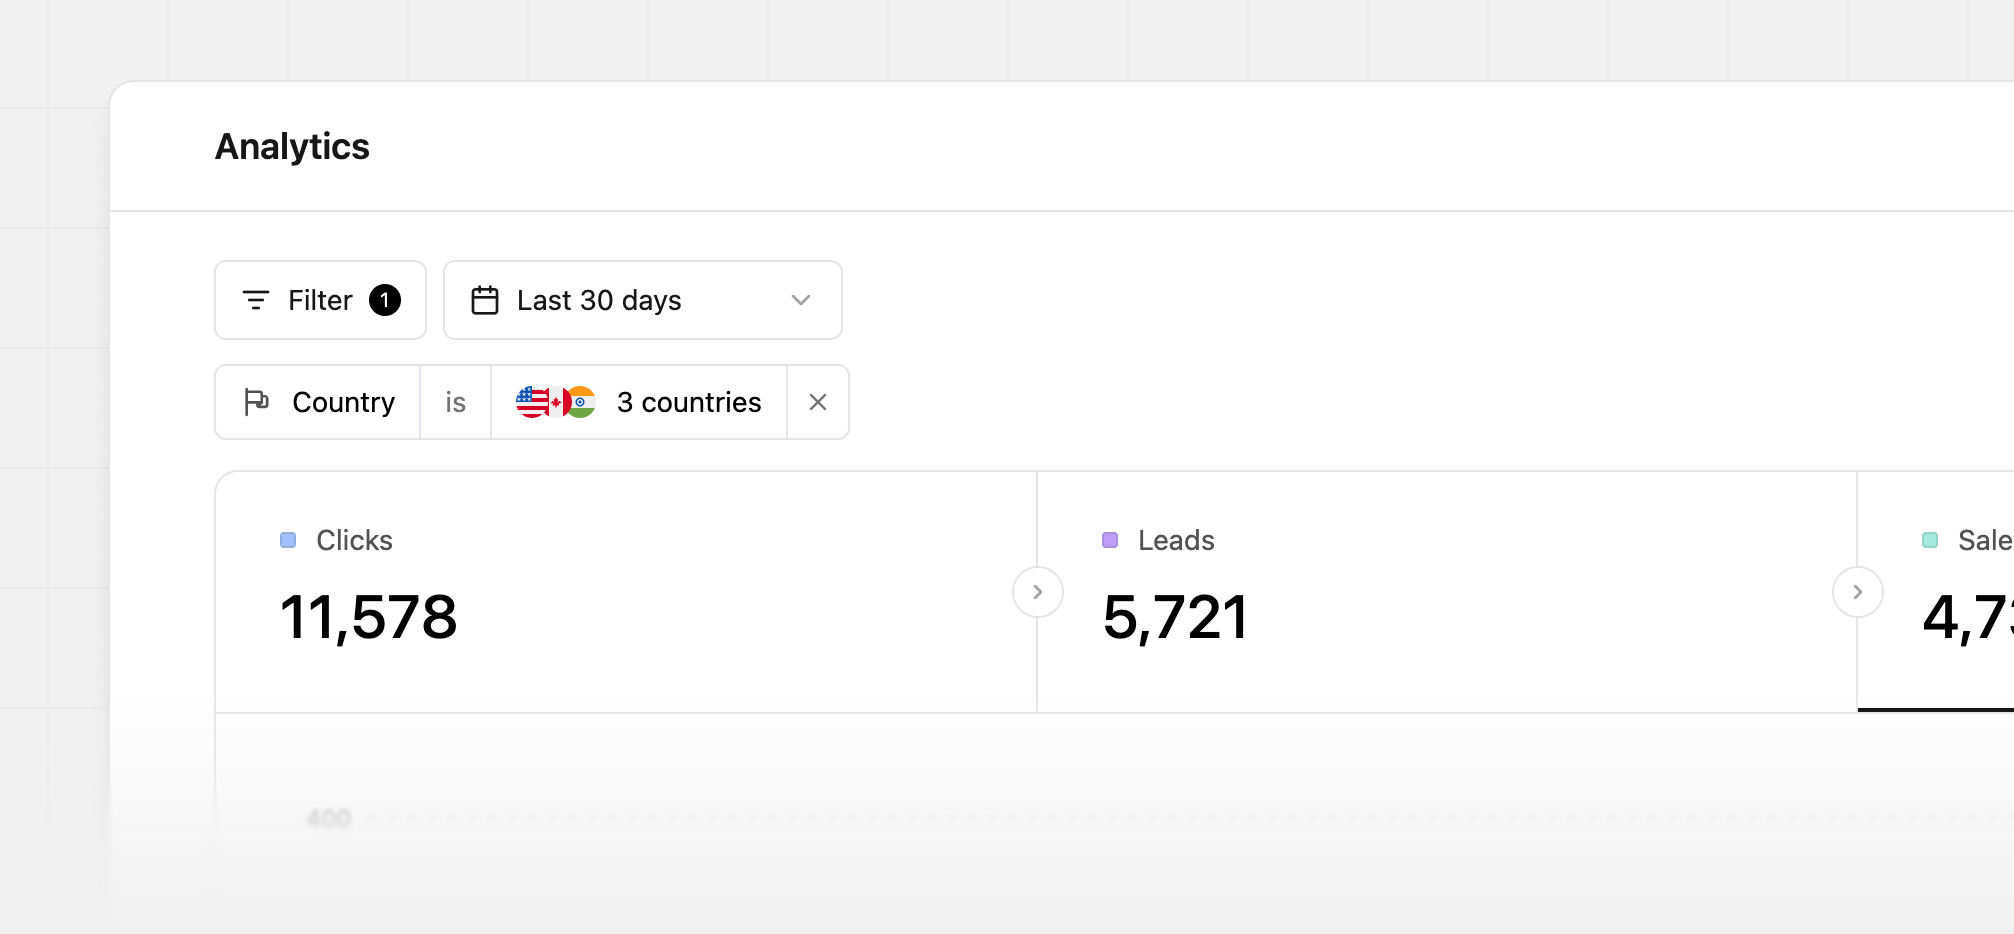 Examples:
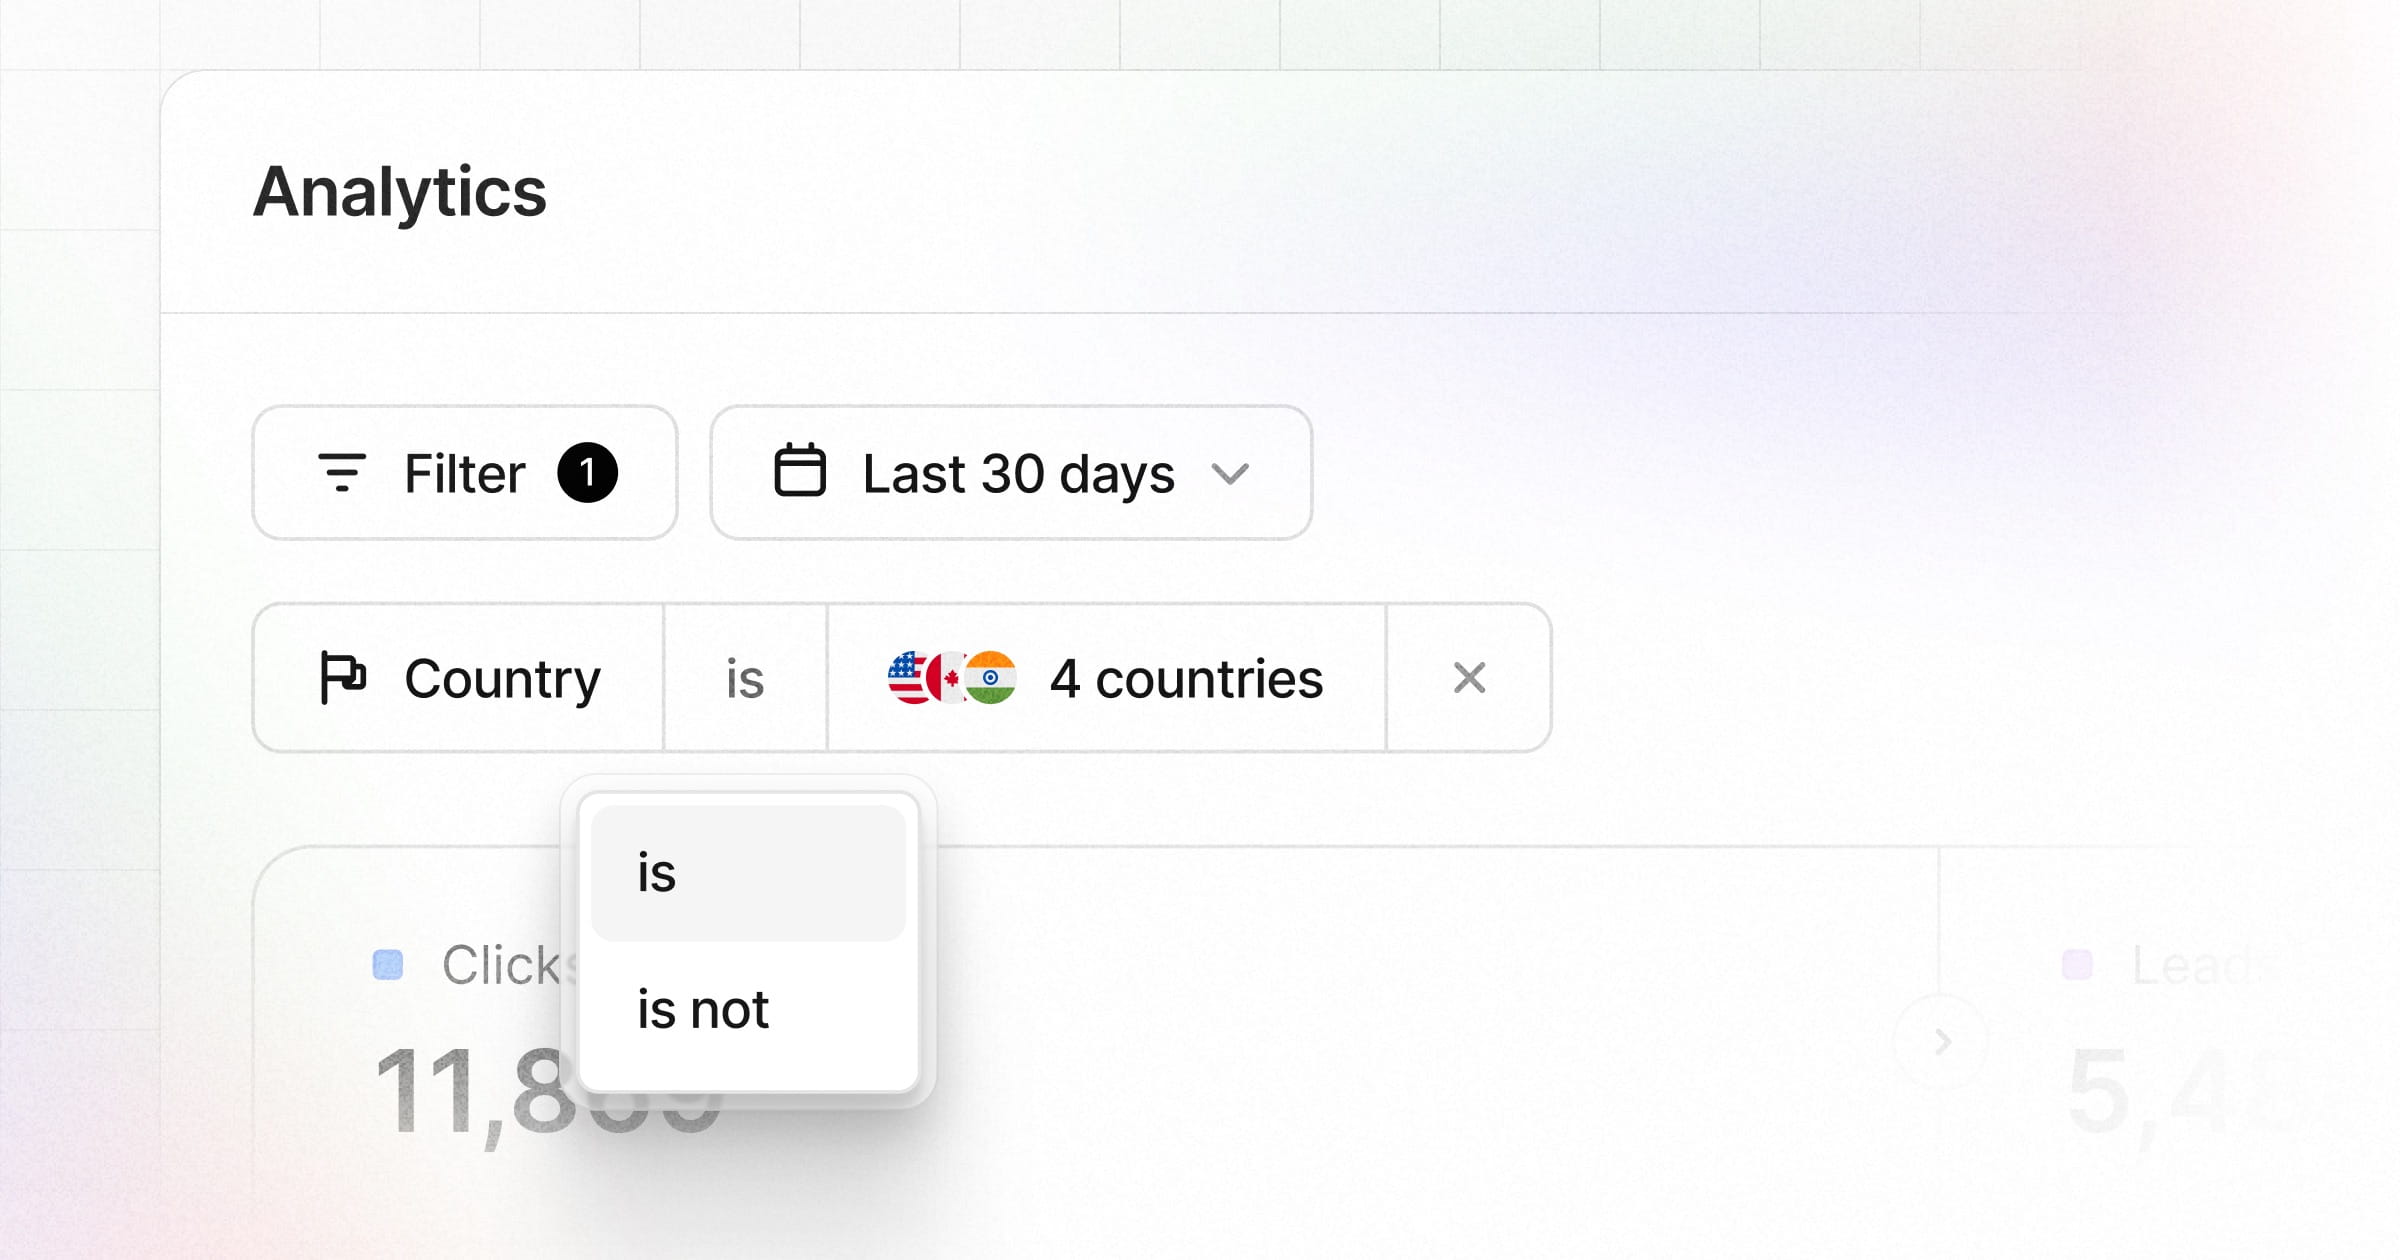
Negative filtering (“IS NOT”)
Additionally, you can also pull stats for all entities ***except*** a select few to make more reporting more robust.
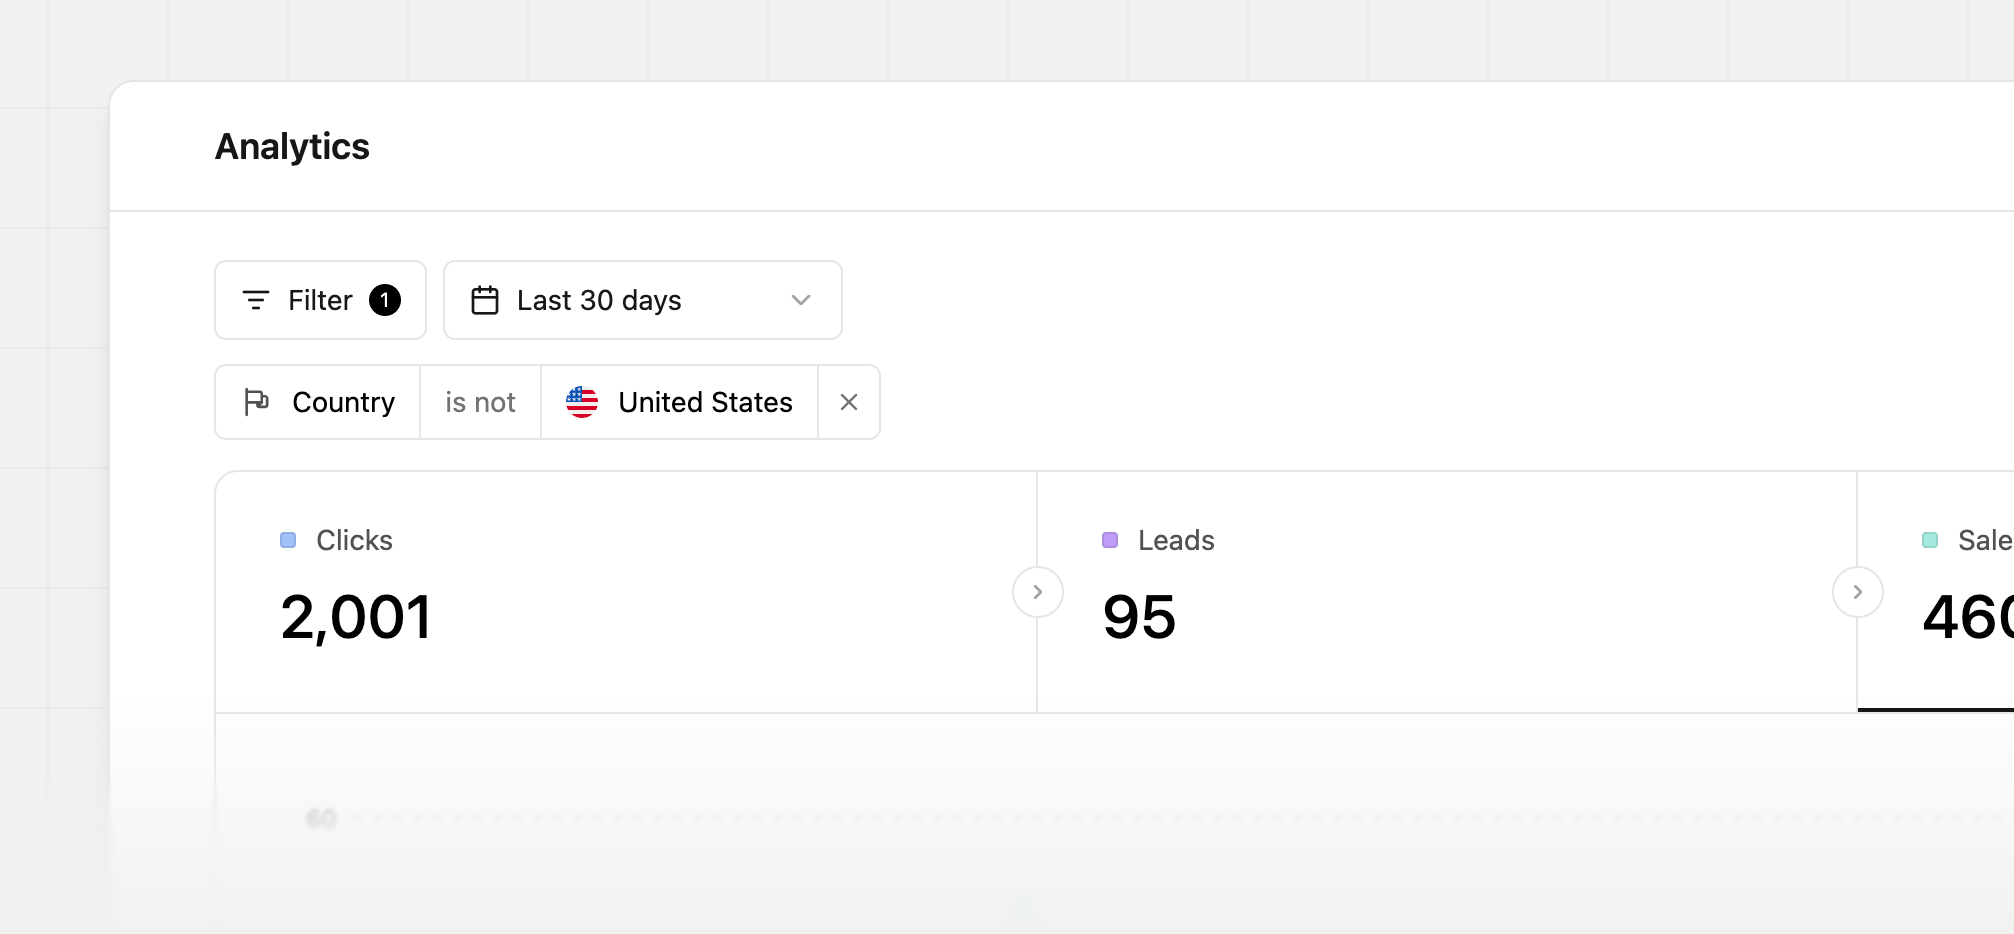 Examples:
- Filtering for non-US traffic
- Filtering for all partners except a few outliers
- Filtering for all partner groups except for “User referrals”
- Filtering for all tags except for “General links”
Best part? You can also mix and match both multi-filtering and negative-filtering as well:
 This is available for both Dub Partners & Dub Links, and you can filter across all of the facets mentioned above.
Check out an example here.
This is available for both Dub Partners & Dub Links, and you can filter across all of the facets mentioned above.
Check out an example here.
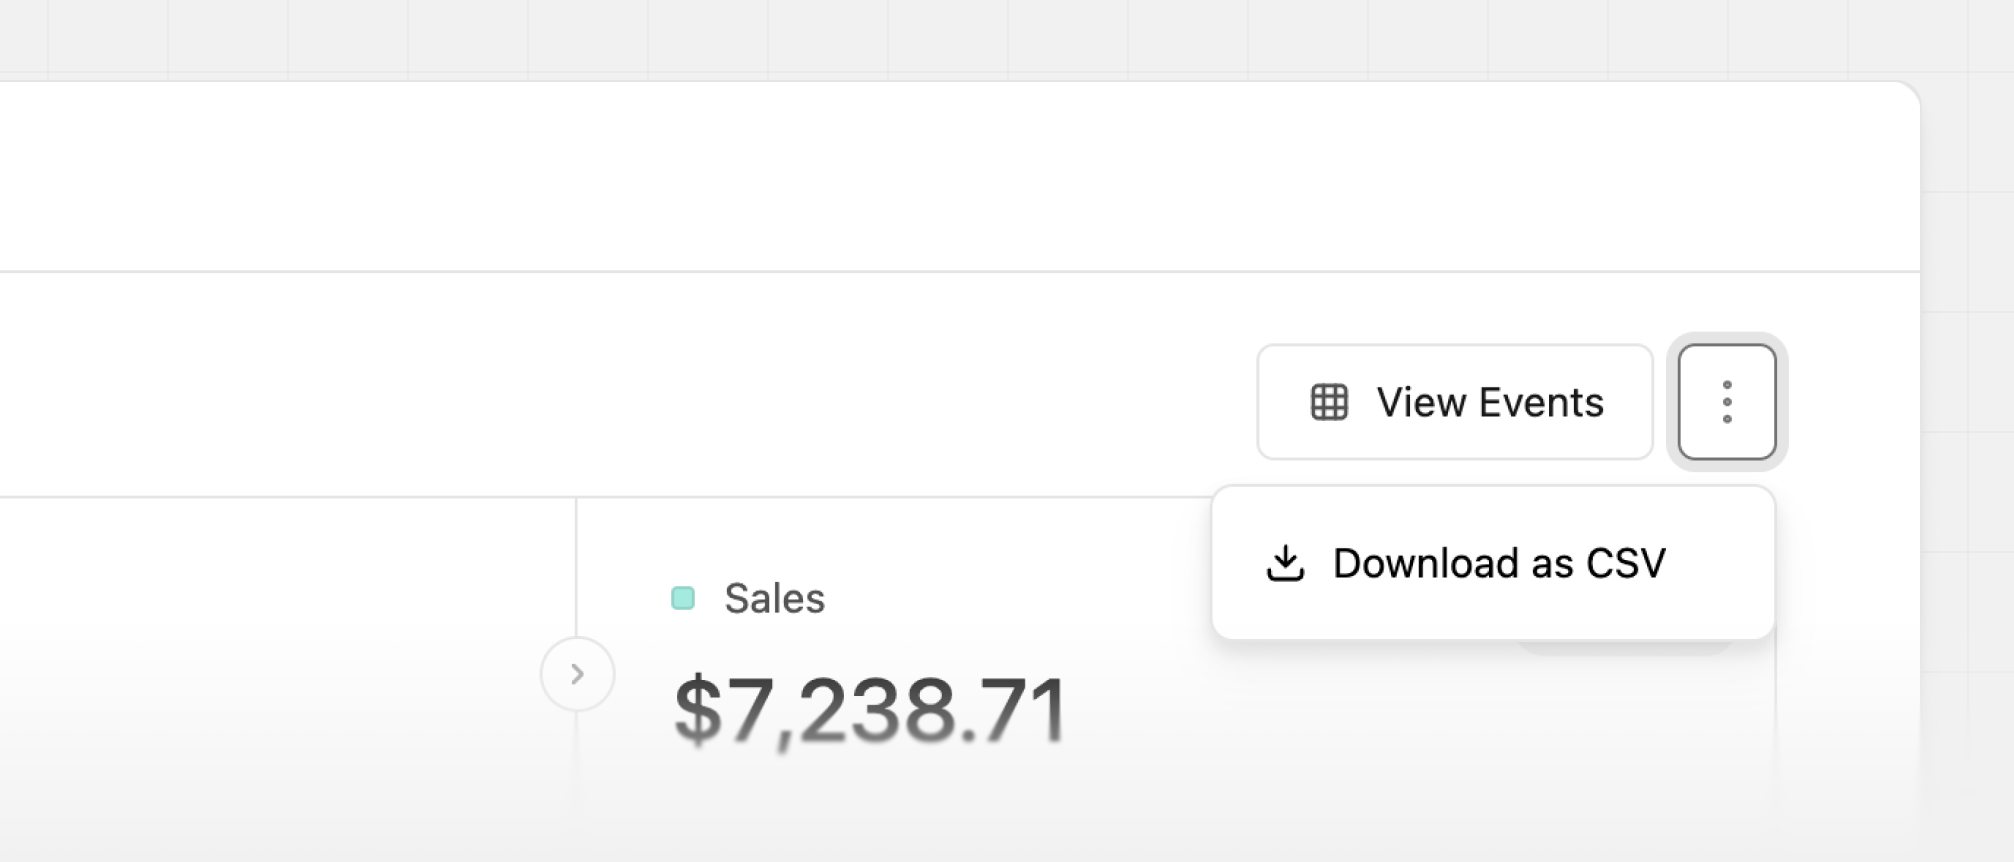
Exporting your analytics data
You can also export your analytics data or events stream data to a CSV file at any time. This can be useful if you want to analyze the data in a business intelligence (BI) tool, share it with your team, or import it into a spreadsheet.
Bonus: “Ask AI” feature
You can also use the “Ask AI” feature to query your analytics with natural language.
For example, you can ask questions like:
And Dub AI will automatically select the right filters and generate a report for you.